
|
Modelling stress joints |
|
|
Modelling stress joints |
A tapered stress joint is a riser joint with a tapered cross section. Stress joints are used to spread loads over a critical section of the riser. Stress joints are typically fabricated from steel or titanium.
Stress joints are modelled in OrcaFlex using profiled line types as follows:
OrcaFlex line segments are straight, that is the diameter is constant over the length of the segment. Each segment in a profile line section has a diameter defined by evaluating the profile data at the mid-point of the segments. Typically, therefore, you will need to use quite short segments to model the taper accurately.
However, since a stress joint is usually placed in a region of concentrated stress which would already require short segments for accurate modelling, the use of straight segments to model the profile is not in practice a significant limitation.
In order to determine an appropriate segment length we recommend that you perform sensitivity studies on segment length.
Profile arc length is defined relative to the start of the line section and increases from end A towards end B. To illustrate this consider a stress joint with outer diameter defined by the following profile:
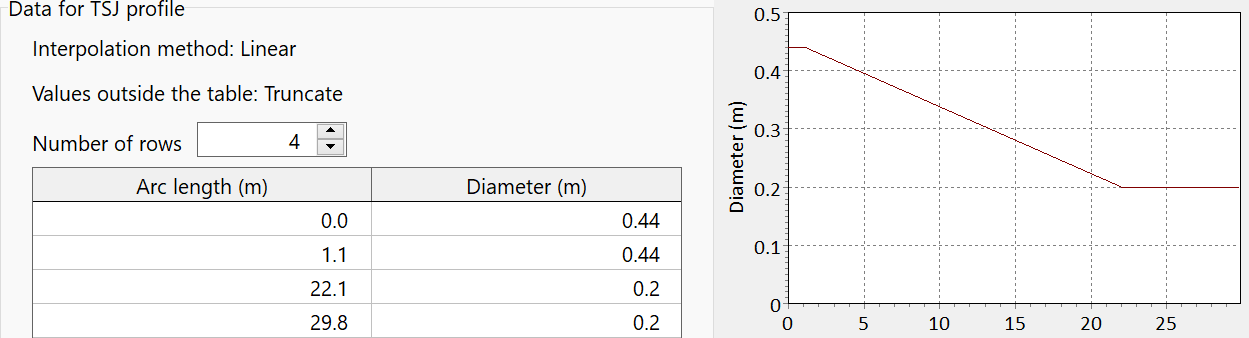
| Figure: | Stress joint profile |
A stress joint specified in this way would commonly be used in the first section of a line. If, however, your stress joint is located adjacent to end B of the line, then the end A to end B convention means that the stress joint would be incorrectly configured. This is easy to check with the profile graph available on the line data form:
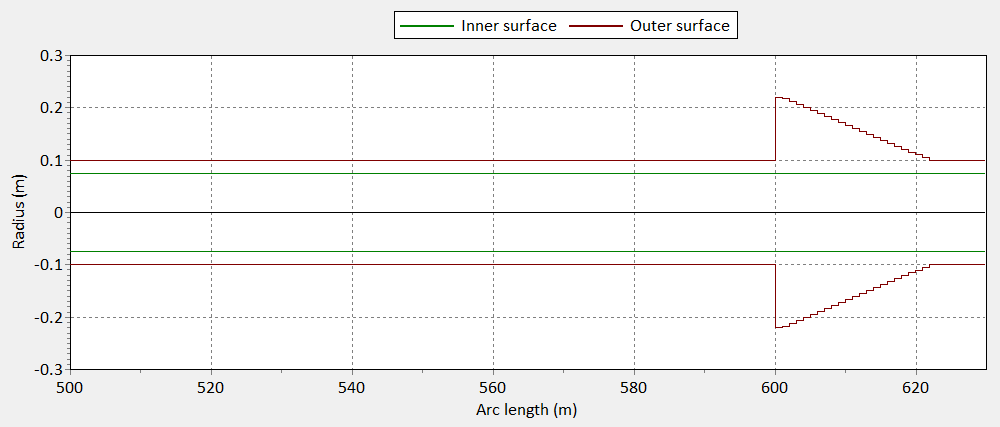
| Figure: | Stress joint profile at end B, incorrectly modelled |
The problem is that the taper is now in the wrong direction: the thicker end of the taper should be adjacent to end B of the line. In order to fix this we simply need to reverse the profile data. This is very simple to do using the reverse button on the variable data form. The result looks like this:
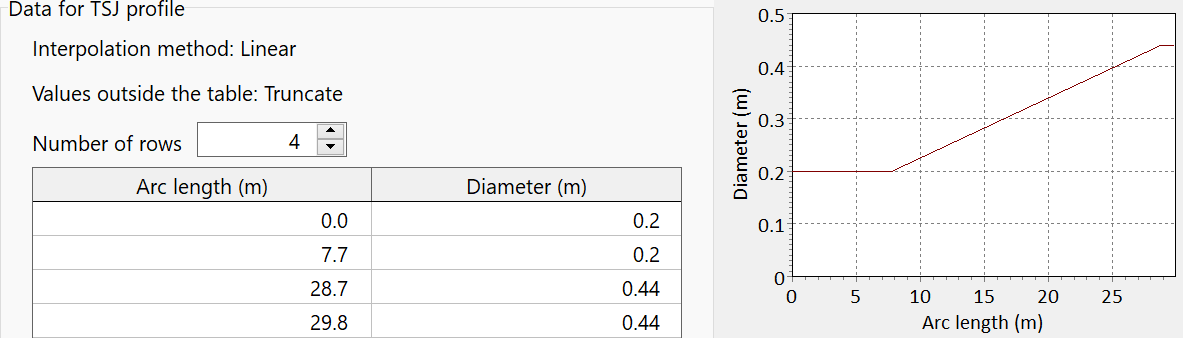
| Figure: | Stress joint profile at end B, corrected |
The line profile graph when using the reversed profile shows that the data are now applied as intended:
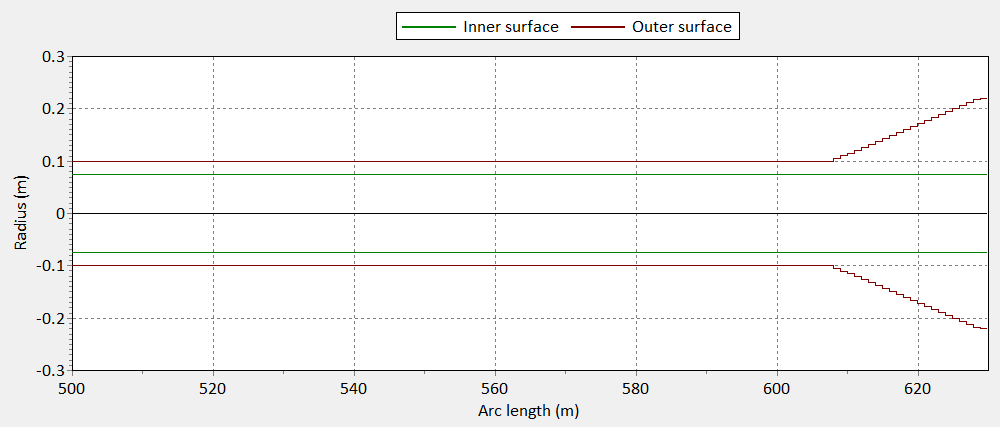
| Figure: | Stress joint profile at end B, correctly modelled |