
|
Post-processing: Instructions wizard |
|
|
Post-processing: Instructions wizard |
The instructions wizard allows you to create OrcaFlex spreadsheet instructions interactively. In many ways it is the equivalent of the select results form in OrcaFlex. The instructions wizard is found on the OrcaFlex tab of the Excel ribbon in an OrcaFlex spreadsheet.
For a quick introduction to the instructions wizard we recommend the following tutorial.
For the purpose of this example you need a simulation file containing at least a vessel and a line – you might find it convenient to use one of the standard OrcaFlex examples.
Now create an OrcaFlex spreadsheet and save it in the same directory as the simulation file. The spreadsheet should now looks like this:
![]()
| Figure: | Empty instructions table |
The instructions wizard creates and inserts instructions on the currently selected row. So the next step is to select the first instruction row by clicking on a cell in row 5. Then open the instruction wizard by clicking on instructions wizard on the OrcaFlex tab of the Excel ribbon.
In the instructions wizard click the drop down button and select the Load command. A file name field and a browse button will now appear. Click the browse button and select the simulation file from the first part of this tutorial. The top part of the instructions wizard should now look something like this:
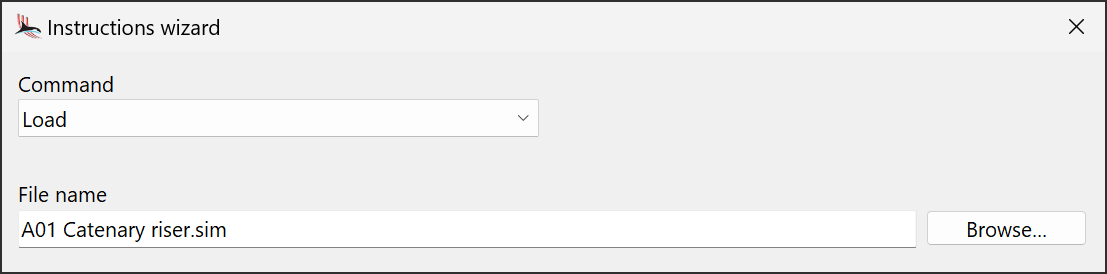
| Figure: | Load instruction in the instructions wizard |
To add the instruction to the spreadsheet click the "accept and close" button and the spreadsheet should now look like this:
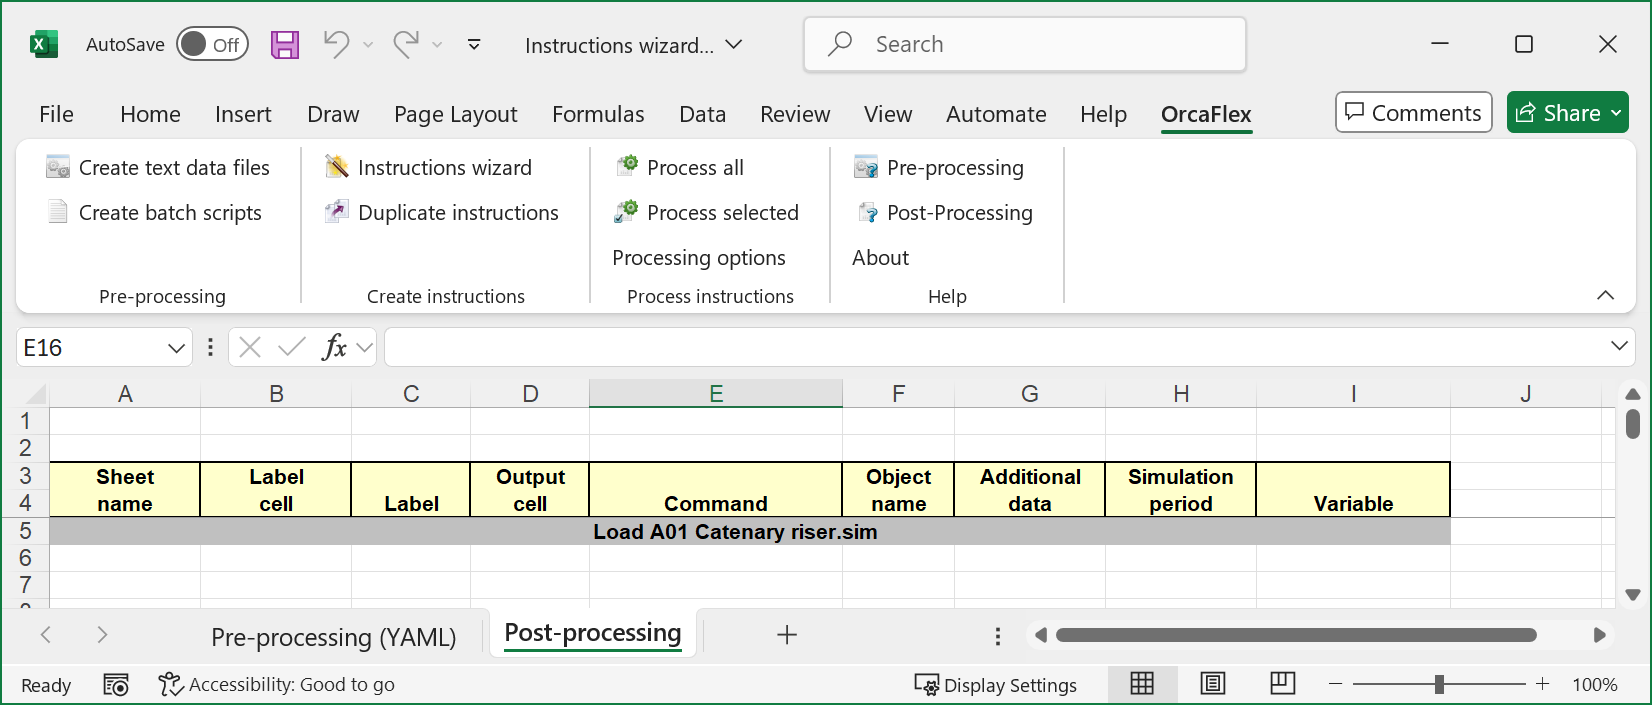
| Figure: | Load instruction on the instructions sheet |
The Load instruction tells the spreadsheet to open the specified file.
Now we need to add some more instructions which specify which results to extract from this simulation file. Open the instructions wizard again and select the Time history command. In the object list select an OrcaFlex line object (if you are using the A01 Catenary Riser example, select the Catenary Hose) and then select effective tension from the list of variables.
This time, to add the instruction click the "accept and go to next" button. You will see the instruction being added to the worksheet but the instructions wizard will remain open allowing you to add yet more instructions.
More than one instruction can be added at once. Suppose that you want time histories of X, Y and Z for the line. Select these from the variables list using CTRL+click or SHIFT+click. The variables list will look like this:
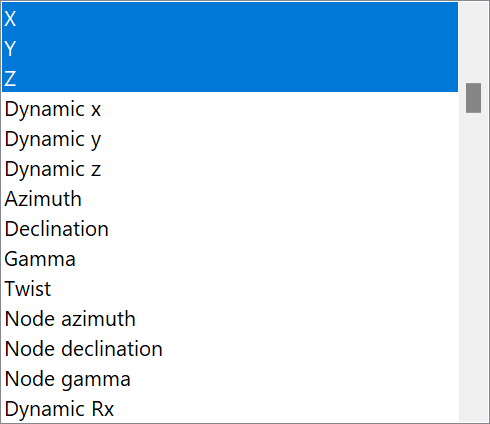
| Figure: | Multiple selection of results |
Click the "accept and go to next" button and you will see three instructions are added, one for each variable. Now close the wizard and process all the instructions. You should see four time histories output on a new worksheet named "Results".
The instructions added so far all used the default simulation period (whole simulation) and the default line position (arc length 0).
In the wizard you can specify a different simulation period by selecting from the period drop-down list. Try selecting different simulation periods and adding further instructions. Notice how the values in the simulation period column reflect your selections in the wizard.
Line results require you to specify the point on the line for which you want the results, e.g. end A, end B, arc length 50, node 12 etc. All these options are available in the wizard when you are choosing results for a line.
In addition, certain results require extra data to define them fully. When you select these results in the list of variables, the appropriate fields for these data items will appear on the instructions wizard.
So far we have looked only at time history results, but the wizard will help you to build other instructions. For example, open the wizard again and select the Range graph command. Notice how slightly different options are available reflecting the fact that range graphs are defined in a slightly different way from time histories.
Try also experimenting with some of the other commands, such as Linked statistics, Sample times, Spectral density, Max, Standard deviation. There are even commands for working with model data: Select, Get data and Set data.
The one part of the instructions wizard which we have not yet discussed is the section titled "labels" as shown below:
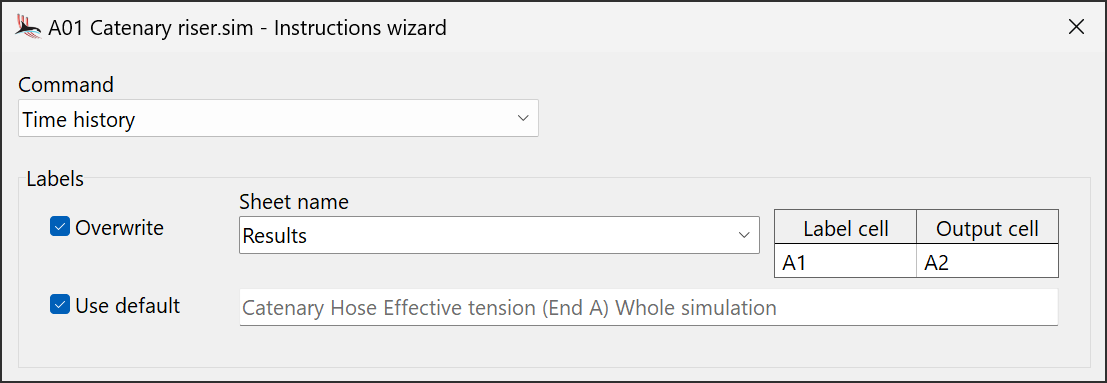
| Figure: | Labels section of the instruction wizard |
This section determines what gets written into the first four columns of the instructions table, namely sheet name, label cell, label and output cell.
If the overwrite option is checked then the wizard will write the values here into each of these corresponding columns. If not checked then the values in the sheet will remain unchanged.
You can choose to use a default label, in which case the text of the label will be constructed from the current instruction. Or you can, of course, choose to enter the label text yourself.
When instructions are added the label cell and output cell values on the instructions wizard will be incremented automatically. This automatic procedure might not always produce the values you require, but you can modify these values on the instructions sheet directly later to suit your purposes.
Some results, for example range graphs, linked statistics, spectral density etc., produce output that includes column headers. There are situations where these column headers are undesirable and if that is so the "exclude header text" box can be checked to suppress their output.